Documentation
2nd
Data Acquired Using BCI2000 P3
Speller Paradigm
BCI
Classification Contest November 2002
Organizer: Benjamin Blankertz (benjamin.blankertz@tu-berlin.de)
Contact: Gerwin Schalk
(schalk@wadsworth.org; 518-486-2559)
Summary
This dataset represents a complete record of P300 evoked potentials recorded with BCI2000[1] using a paradigm described by Donchin et al., 2000, and originally by Farwell and Donchin, 1988. In these experiments, a user focused on one out of 36 different characters. The objective in this contest is to predict the correct characters in one of the three provided sessions.
The Paradigm
The user was presented with a 6 by 6 matrix of characters (see Figure 1). The user’s task was to focus attention on characters in a word that was prescribed by the investigator (i.e., one character at a time). All rows and columns of this matrix were successively and randomly intensified at a rate of 5.7Hz. Two out of 12 intensifications of rows or columns contained the desired character (i.e., one particular row and one particular column). The responses evoked by these infrequent stimuli (i.e., the 2 out of 12 stimuli that did contain the desired character) are different from those evoked by the stimuli that did not contain the desired character and they are similar to the P300 responses previously reported (Farwell and Donchin, 1988, Donchin et al., 2000).
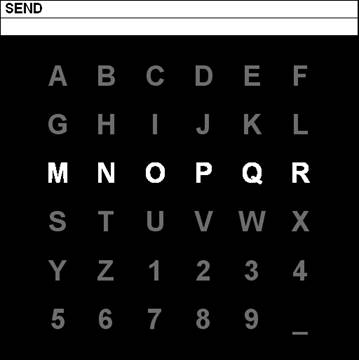
Figure 1: This figure illustrates the user display for this paradigm. In this example, the user’s task is to spell the word “SEND” (one character at a time). For each character, all rows and columns in the matrix were intensified a number of times (e.g., the third row in this example) as described in the text.
Data Collection
We collected signals (digitized at 240Hz) from one subject in three sessions. Each session consisted of a number of runs. Each run is stored in one Matlab file (e.g., file ‘AAS011R06.mat’ for session 11, run 6). In each run, the subject focused attention on a series of characters (see table for the target word for each run in session 10 and 11). For each character, user display was as follows: the matrix was displayed for a 2.5 s period, and during this time each character had the same intensity (i.e., the matrix was blank). Subsequently, each row and column in the matrix was randomly intensified for 100ms (i.e., resulting in 12 different stimuli – 6 rows and 6 columns). (After intensification of a row/column, the matrix was blank for 75ms.) Row/column intensifications were block randomized in blocks of 12. Sets of 12 intensifications were repeated 15 times for each character (i.e., any specific row/column was intensified 15 times and thus there were 180 total intensifications for each character). Each sequence of 15 sets of intensifications was followed by a 2.5 s period, and during this time the matrix was blank. This period informed the user that this character was completed and to focus on the next character in the word that was displayed on the top of the screen (the current character was shown in parentheses).
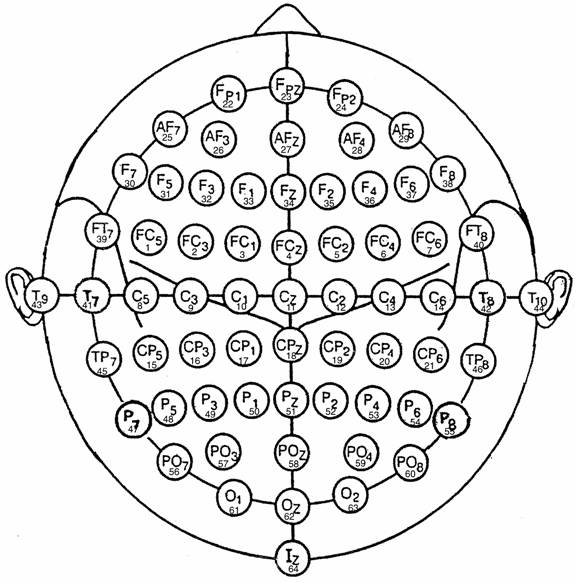
Figure 2: This
diagram illustrates electrode designations (Sharbrough,
1991)
and channel assignment numbers as used in our experiments.
The Data
For each run (e.g., AAS010R01.mat), the EEG signal is stored in one big matrix signal (total # samples x 64 channels). Other variables define the run number (runnr), number of intensification within the run (trialnr), and sample number within the run (sample). Please refer to Figure 3 for an illustration.
For each intensification/trial, events are coded using additional variables:
Flashing: 1 when row/column was intensified, 0 otherwise
PhaseInSequence: 1 during PreSetInterval (i.e., for each character, when matrix
is blank (i.e., before row/column intensifications started))
2 while row/columns are intensified
3
duringPostSetInterval (i.e., for each character, when
matrix is
blank
(i.e., after row/column intensifications start)
This
variable can be used to determine which character was on the
screen,
i.e., whenever this value switches from 3 to 1, there
is a new character on the screen
StimulusCode: 0 when no row/column is being intensified (i.e., matrix is blank)
1…6 for intensified columns (1 … left-most column)
7…12 for intensified rows (7 … upper-most row)
See Figure 4 for details.
StimulusType: 0 when no row/column is being
intensified or intensified
row/column
does not contain desired character
1 when intensified row/character does contain the desired character
This
variable provides an easy access to the labels in the training
set
(sessions 10 and 11) in that it can be used to separate the
responses that did contain the desired character from the ones that
did not. (Obviously, this could also be done using the variable
StimulusCode in conjunction with the words that the user focused
on.)
It only takes a few steps to extract the signal waveforms associated with the intensification of a particular row/column:
· Find all signal samples that hold the period after one intensification.
· Determine the StimulusCode for this period.
· Accumulate associate signal samples in separate buffers, one for each stimulus.
To get the indices of all samples for the time period after one intensification (i.e., for an intensification specified by cur_trial), one would use the following code:
trialidx=find(trialnr
== cur_trial);
Please note that responses to the stimuli overlap with
subsequent trials. In other words, the rate of presentation is faster than the
delay of the responses. Thus, signals need to be extracted
that overlap with the presentation of the next row/column.

Figure 3: This figure illustrates the content of each Matlab file. Channel numbers (e.g., columns in the variable signal (i.e., a matrix of total # samples x 64 channels) correspond to channel numbers in Figure 2. See text for a description of the vectors runnr, trialnr, and sample. Additional variables encode intensification variables (refer to text and Figure 4 for details).
Figure 4: This figure illustrates the assignment of the
variable
StimulusCode
to different row/column intensifications.
Demonstration Code
·
example.m
This program compares responses to target vs. non-target stimuli (i.e.,
stimuli that did/did not contain the desired character) for session 10, run 01.
Please note that in this example, Figures 4 and 5 are meaningless since data
for all three characters are analyzed !!
·
testclass.m
This program uses a very simple classifier to predict the first character of
the word in session 12, run 01. It uses one sample at Cz and 310ms after intensification for
classification. It determines the target character as the character with the highest
amplitude (at Cz/310ms). It does this for the first character in the word in
session 12, run 01. We do not specify whether the resulting character is or is
not correctly predicted.
Demonstration Analyses
Figure 5: This figure shows a
topography of values of r2 (i.e.,
the proportion of the signal variance that was due to whether the row/column
did or did not contain the desired character), calculated for one sample at
310ms after stimulus presentation. This topography shows that there is a
spatially fairly wide-spread difference at 310ms after intensification of a
row/column that is different for rows/columns that did vs. ones that did not
contain the desired character.
Figure 6: This figure shows the time course of the actual average signal waveforms (at Cz) and of r2 (i.e., the proportion of the signal variance that was due to whether the row/column did (oddball) or did not contain the desired character (standard)).
Figure 7: This figure shows the output of the provided script testclass.m. It shows averaged responses for each character (each character response is calculated as the average of the corresponding average row and column responses), and the character that was predicted for these data using a very simple classification procedure.
Words
To Predict
|
Session |
Run |
Target Word |
|
10 |
1 |
CAT |
|
10 |
2 |
DOG |
|
10 |
3 |
FISH |
|
10 |
4 |
WATER |
|
10 |
5 |
BOWL |
|
11 |
1 |
HAT |
|
11 |
2 |
HAT |
|
11 |
3 |
GLOVE |
|
11 |
4 |
SHOES |
|
11 |
5 |
FISH |
|
11 |
6 |
RAT |
Table 1: This table illustrates the words that the
subject was
focusing on in run 10 and 11.
The Goal in the
Contest
The goal in this competition is to use the labeled data (i.e., using the variable StimulusCode that determines whether there should have been a P300 response in the data) in session 10 and 11 to train a classifier, and then to predict the words in session 12 (i.e., one word for each of the 8 runs in this session). You need to submit a file ‘results.dat’ that contains 8 words in ASCII – one word in one line (lines delimited with carriage return/line feed – ASCII code 13 and 10). Words need to be uppercase. The following is an example of a valid submission file (the word lengths in this example do not match the word lengths in the actual data set):
WORD
TEST
BCI
RENEE
BLOW
FOG
HAVE
WINE
We will compare the submitted words with the actual words character by character to determine % correct (DO NOT CHEAT, e.g., by correcting words after classification). The submission with the highest % correct wins the competition. In case competition participants are confident of their results, it would be interesting if they can produce the same results with fewer than 15 sequences of intensifications.
Bibliography
Farwell
L.A., Donchin, E. Talking
off the top of your head: toward a mental prosthesis utilizing event-related
brain potentials. Electroencephalography & Clinical
Neurophysiology. 70(6):510-23, 1988.
Donchin, E., Spencer, K.M., Wijensinghe,
R. The mental prosthesis: Assessing the speed of a P300-based brain-computer
interface. IEEE Trans. Rehab.